Mobile Gaming Reloaded: Localizing the face of mobile Gaming
By: Sehar Khan Posted on Wed, 21-02-2018

Mobile Gaming Reloaded: Localizing the face of mobile Gaming Landscape
This is the age of accessibility and widespread reach. English is no longer the only language of global communication. Perhaps this is the reason that organizations are localizing themselves to ensure their businesses are able to reach everyone. The mobile gaming industry is a living proof of such businesses that are striving to localize themselves to be accessible to the gamers across the world.
New markets are gaining foothold and trends such as augmented reality are gathering mainstream attention. What do these trends mean for mobile game developers and how does it affect the distribution of their games, localization and spends? To help mobile game developers answer these queries, we decided to provide some insights on the changing landscape of mobile gaming:
How the World Plays:
The world map of gaming revenue, spread across 6 continents indicates that mobile gaming market is indeed a booming one. Asia Pacific is the world leader in revenue generation, with a magnanimous spend of $27.5 billion in 2017. North America and Western Europe come next, with $8.26 billion and $4.92 billion, respectively. The lowest revenue figures are held by Latin America and East Europe that garnered $1.71 billion and $1.30 billion in revenues in 2017. Nevertheless, these are markets with a positive outlook of progressing in the future, thanks to enhanced gaming experience.

The above picture displays revenues by the regions gained from mobile games market. The interesting thing to notice?—the average annual spend per paying gamer. The average mobile game user of North America spends approximately $108.36 every year on his games. Not surprisingly, this market yields 10% year-on-year growth. The Middle East is the most lucrative of the markets with 46% year-on-year growth. The world sure spends big bucks on games!
The Battle of Operating Systems:
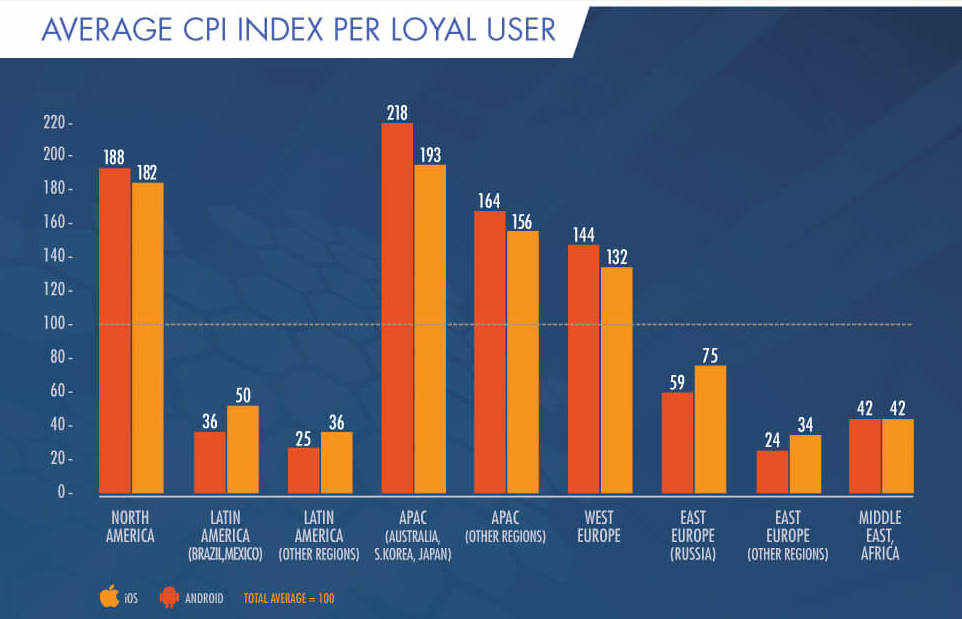
When one hears the word “games”, mobile is not the first thing to pop into the mind. Focus on the statistics, and the case is different. Over the years, the two main providers of mobile games—IOS and Android have gone head-to-head in the bid to be on top of the game.
The average CPI Index per user in Asia Pacific region (Australia, South Korea and Japan) show the highest figure, with North American market and Western Europe following suit. In this battle of games, it is evident that mobile game users prefer Android over IOS in the high-revenue regions. However, the competition is intense and is likely to remain so in the coming days.
A Promising Future:
Newzoo’s latest quarterly update reveals interesting insights on the gaming population. The gigantic population of 2.2 billion gamers across the world is expected to generate $52.6 billion in game revenues in 2018.
The gaming segment has shown a rewarding figure of $46.1 billion in 2017, accounting for 42% of the total market. This trend has kept in line with an increase of $7.8 billion, or 7.8% from the previous year. If this upward trend is anything to go by in the future too, this revenue is likely to increase to $64.9 billion in 2020.

The mobile games landscape is changing its face. Which countries, mobile operating systems and user groups will emerge as the winners in the upcoming years, however, remains to be seen.
Mars Translation provides games translation and localization in wide variety of genres and formats. It covers thousands of translated words and hundreds of hours of in-language gameplay, delivering a global ground for mobile gamers. Every mobile game user is welcome here, every game format is supported and the best localization and translation value ensured, irrespective of country or language.

Africa is the second largest and second most populous continent. As recent statistics suggest, 1,486,275,887 is the current population of
Read more
No state on the western side of the globe can compare the strategic geographic location, diverse multilingual workforce, and attention
Read more
San Diego is California's second-largest city, and it has a population of 1.3 million from which three million residents are
Read more
Dallas is the largest state in Texas after Houston and San Antonio. It is the ninth most populous city in
Read more
In this day and age, users love to consume video content. Statistics show that almost 90% of all internet users
Read more
Virtual reality is transforming our imaginative worlds into existence. Since childhood, we used to create visionary kingdoms and act like
Read more
Switzerland is a landlocked country with a very interesting history. The culture and languages spoken in Switzerland are highly influenced
Read more
Digitalization has played a great role in this global world. People seek the internet to find the solution to everything.
Read more
Creating massive amounts of content, buying ads, and keeping the social media game up is what most businesses would do
Read more